Ticker
Definition / Formula
The instrument symbol, as reported by the scanner.
display = asset.length > 20 ? asset.slice(0, 19) + ellipsis : asset
UI Breakdown
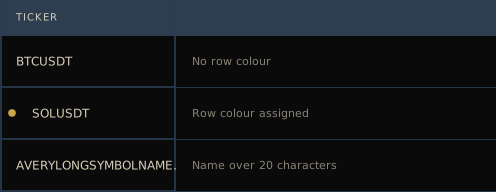
The cell is a button that loads the symbol on the chart. A colour dot renders to the left of the name when a row colour is assigned; the dot is 8 px and shifts the text right by 16 px.
| Control | Action | Effect |
|---|---|---|
SYMBOL box above the column | type | substring, case-insensitive |
| Column header | click | sort ascending (smallest first); click again to flip |
| The cell | click | load the symbol on the chart |
Value Ranges
| See | Value Band | Status | Visual Appearance |
|---|---|---|---|
 | No row colour | No row colour assigned | Symbol text only |
 | Row colour assigned | Colour tag set | 8 px dot left of the symbol |
 | Name over 20 characters | Name exceeds the column budget | First 19 characters plus an ellipsis |
Summary: Ticker identifies the instrument and opens it on the chart.