(R) BTC Correlation
Definition / Formula
Pearson correlation of log returns against BTC, computed on closed 5-minute bars aligned by timestamp.
r = pearson( ln-returns of the instrument, ln-returns of BTC )
Window: the last 96 aligned 5-minute returns (97 closes), that is 8 hours.
Minimum sample: 40 aligned return pairs. Below that the cell is empty.
No BTC row: when the scan holds no BTC instrument, as in TradFi mode, every cell is empty.
Rounding: the value is rounded to two decimals before the arm is drawn.
Fixed value: the BTC row itself reports 1.00.
UI Breakdown
                 centre
track   |-----------|-----------|
arm                 |=====|            r positive, grows right
arm           |=====|                  r negative, grows left, inverted colour
label                          +0.72
The arm grows from the centre line. Its width is |r| * 50 percent of the track, so a perfect correlation fills one half. No arm is drawn while |r| is below the dead zone of 0.25. The label is signed and carries two decimals.
| Control | Action | Effect |
|---|---|---|
| Column header | click | sort descending (largest first); click again to flip |
Value Ranges
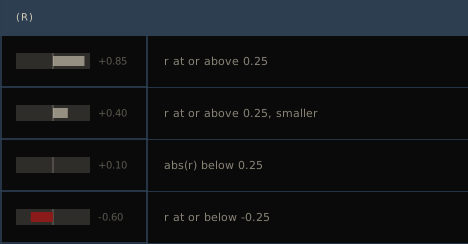
| See | Value Band | Status | Visual Appearance |
|---|---|---|---|
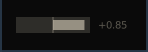 | r at or above 0.25 | Positive correlation | Arm right of centre |
 | r at or above 0.25, smaller | Positive correlation | Shorter arm right of centre |
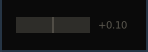 | abs(r) below 0.25 | Inside the dead zone | Empty track, label only |
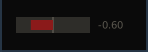 | r at or below -0.25 | Negative correlation | Inverted arm left of centre |
Summary: (R) reports the linear correlation of the instrument returns against BTC over the last 96 five-minute returns (8 hours).