2D
Definition / Formula
The last 12 closed 4-hour candles, drawn as OHLC, plus the net change over that window.
% change = ( close(last candle) - open(first candle) ) / open(first candle) * 100
displayed = abs(% change) rounded to 1 decimal
The sign is carried by colour, not by the number.
The candles are Binance 4-hour candles on the UTC grid (00:00, 04:00, 08:00 and so on). The 12 are taken by position, so a missing candle stretches the window beyond 48 hours. Fewer than 12 closed candles leave both cells empty.
UI Breakdown
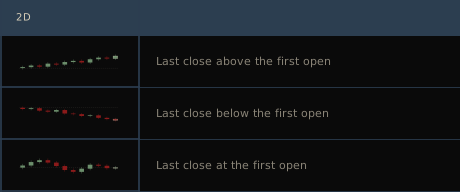
    high  |                     dashed baseline = open of the first candle
          |   [] [] []  <- body drawn from open to close
    low   |   ||          wick drawn from high to low
          +--------------------------------------------
                                last candle outlined
The vertical scale is fitted to the window: the lowest low and the highest high of the 12 candles, padded by 10 percent of that range. A candle whose close is at or above its open uses the up colour; otherwise the down colour. The dashed horizontal line marks the open of the first candle. The final candle carries an outline.
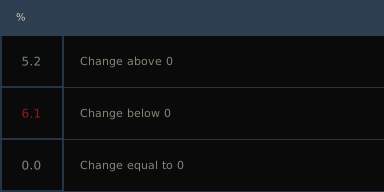
The change value is rendered in the adjacent column.
| Control | Action | Effect |
|---|---|---|
| Column header | click | sort descending (largest first); click again to flip |
Value Ranges
| See | Value Band | Status | Visual Appearance |
|---|---|---|---|
 | Last close above the first open | Net gain | Candles, last one outlined |
 | Last close below the first open | Net loss | Candles, last one outlined |
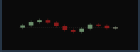 | Last close at the first open | No net change | Candles, last one outlined |
 | Change above 0 | Net gain | Up colour |
 | Change below 0 | Net loss | Down colour |
 | Change equal to 0 | No net change | Flat colour |
Summary: 2D shows the last 12 4-hour candles and the net percentage change across that window.